
A Guide To Managing Bar Costs Effectively
Understanding costs in any bar or restaurant venue is fundamental to long-term success. Learn how to manage resources efficiently and effectively.
Estimated reading time: 7 minutes

A GUIDE TO UNDERSTANDING COSTS
Successful bar and restaurant operations keep a tight eye on their expenses so that they don’t boil over. Understanding costs is fundamental to making sound financial decisions, optimising your operations, and ensuring the long-term success of your venue. It enables you to manage resources efficiently, maintain healthy profit margins, and provide a great experience to your customers while running a sustainable business.
Operating costs commonly associated with bar and restaurant businesses can include:
- Food & beverage expenses
- Labour cost
- Mortgage or rent
- Utilities
- Maintenance (upkeep of equipment, cleaning etc)
- Others (marketing expenses, licenses, taxes etc)
TYPES OF COSTS
For the purpose of effective financial management (and accounting), we will group the multiple costs to provide a clear view of where expenditure is, to inform business sound decision.
Broadly, all costs involved in running a bar and restaurant can be categorised as Fixed Costs or Variable Cost. Fixed cost includes expenses that remain constant for a period of time, irrespective of the level of outputs, while variable costs are expenses that change directly and proportionally to the changes in business activity level or volume. In the long run, all costs are variable.
Fixed Costs (FC)
Fixed costs are predetermined expenses that remain the same throughout a specific period. These overhead costs do not vary with output or how the business is performing. Some examples of FC are:
- Mortgage or Rent
- Salaries of Full-time Staff
- Insurance
- Loan Payments
- Utilities*
Any restaurant or bar owner will have certain fixed costs regardless of whether there is any business activity. As these remain the same throughout the financial year, fixed costs are easier to budget. However, they are also less controllable than variable costs because they’re not related to operations or volume.
Variable Costs (VC)
Variable costs change over a specified period and are associated directly to the business activity. These are based on the business performance and the volume of services the business generates. Since they are changing continuously and the amount you spend on them differs monthly, variable expenses are harder to monitor and control. They can decrease or increase rapidly, affecting your profit margins or loss.
Some examples of variable costs include:
- Cost of Goods Sold (COGS)
- Salaries for causal labour
- Disposable supplies (e.g. napkins, coasters)
*Note that while water and electricity costs will increase when there are more customers, bars will still need to consume utilities even if the business is poor e.g., aircon, lights, refrigerators etc. as such, sometimes costs that waver between being fixed and being influenced to a degree by factors like sales volume are termed as Mixed Costs. However, since these typically do not drift too far from norm, they are usually included as Fixed Costs.
HOW TO ANALYSE BREAK-EVEN POINT
Break-even point is the point where total revenue equals total cost (fixed and variable costs). The break-even analysis helps you find out how much revenue your restaurant needs to generate to exactly cover your costs or make a $0 profit.
Operators can use this information to set sales targets, control costs, and hit target profitability and business growth.
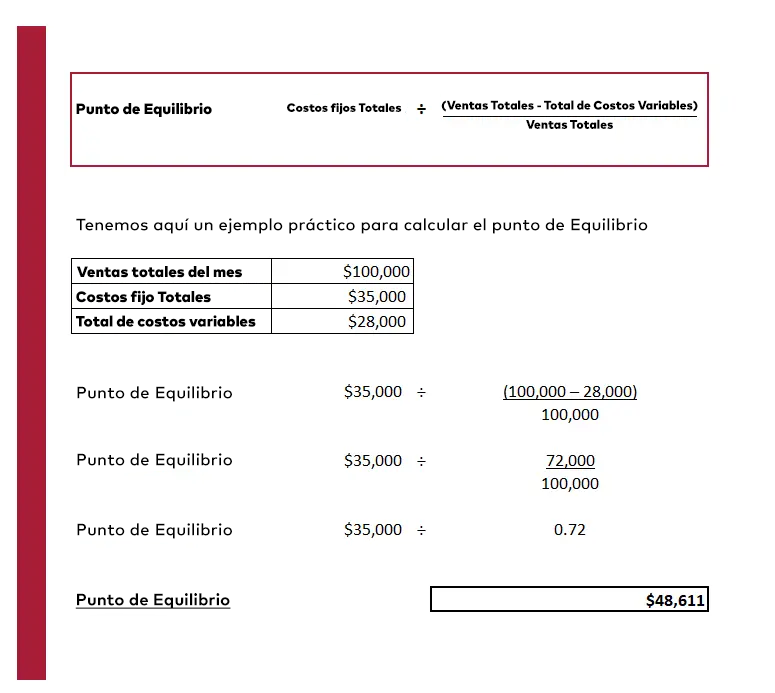
Calculating Break Even Point (BP)
Using this simple formula will only require three values. Once we’ve categorised fixed and variable costs for a given period (say a month), this formula allows us to quickly calculate the bar’s break-even point in sales dollars.


How to establish profit margins and growth
To go one more step further, let’s assume that using sales record, the average spend per customer is $30. We can now calculate that to break even, we require $48,111 ÷ $30 = 1,620 guests per month, which translate to 53 guests per day in a 31-day month. With these data, we could now set targets to achieve the desired profit margins and growth.
CALCULATING BEVERAGE (OR FOOD) COSTS
The first and most important lesson to learn in the bar and restaurant business is to control Cost of Goods Sold (COGS). Depending on your location, the average beverage cost in a bar may range between 25-45% of total beverage sales. This is a huge chunk of your revenue, and the difference between making good money and working hard for very little.
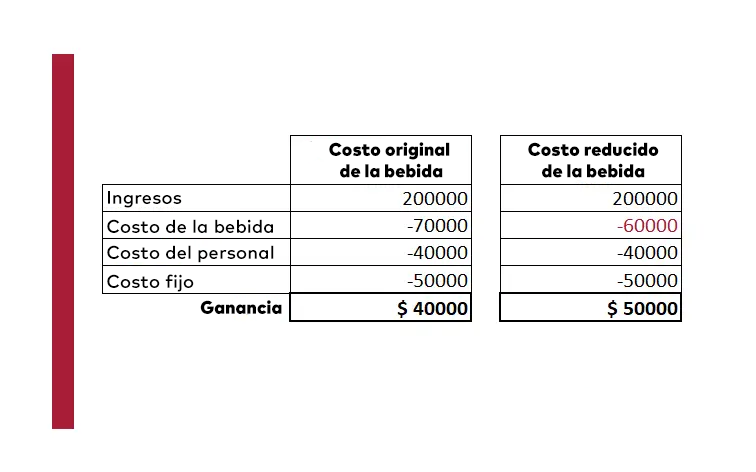
Gross Proft (GP) is the total revenue minus expenses directly related to the production of goods (i.e. COGS) while Gross Operating Profit (GOP) also known as Gross Operating Income is the difference between revenue (sales) and operating costs (FC + VC). Either way, the lower the variable cost is, the higher your profit will be. Note that terms may differ in different accounting practices and countries. We are only discussing basic principles for costings in this article.
In the example below, a 14% drop in beverage will result in an increase in profit by 25%!

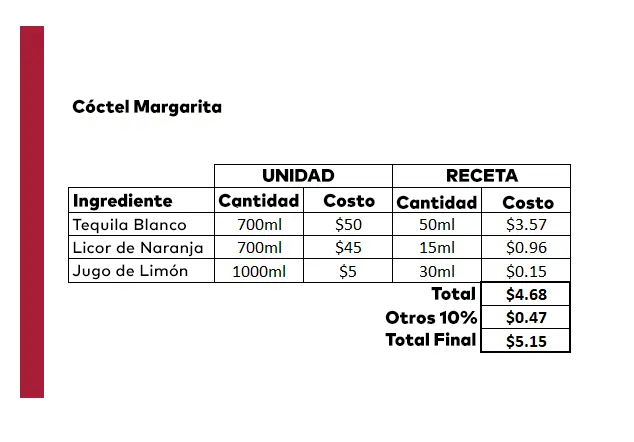
Costing a Cocktail
Good cost control starts with a detail breakdown of how much each item in your menu cost. We will need four key pieces of information:
- Ingredients in Recipe
- Unit cost of each ingredient
- Quantity used
- Recipe Cost (add 5 or 10% to cover any miscellaneous items such straw or garnish)

Actual Beverage Cost %
To make sure your business stays profitable, regular, and accurate calculations of beverage costs are a must. The actual food cost is the value by which your stock decreases over a given period. In other words, it is the depletion of inventory set against its value in money.
Calculating actual food cost requires accurate stock counts. This may be labour-intensive and time-consuming, and requires lots of discipline but it’s a mission-critical task. Fortunately, today there are many software options available to help. The below formula demonstrates how to calculate actual beverage cost in a specific period (usually a month).
In order for this information to be useful, we will then need to convert actual beverage cost to actual beverage cost percentage. Simply use the formulas below.

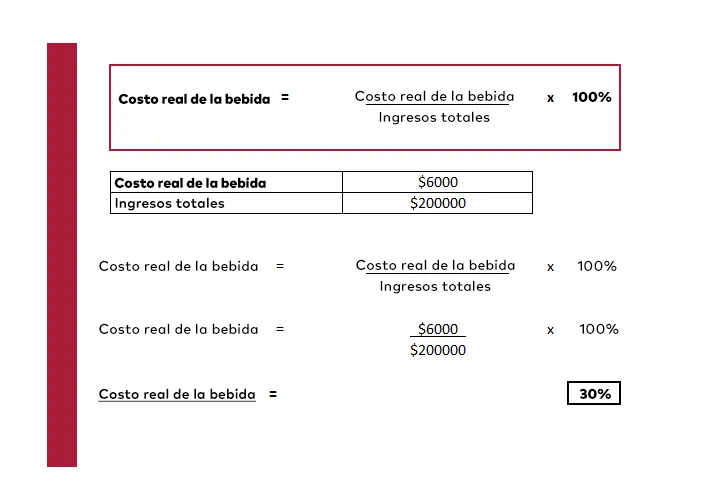
The actual beverage cost % for the month is 30%. With this information, we will move on to compare this to our Ideal Beverage Cost %.
Ideal Beverage Cost %
To calculate the ideal beverage cost, we first need to determine the cost of each menu item. We have done this in the Margarita cocktail example above. Take these costs and multiply by the sales mix, that is the quantity of each item that was sold over the course of the month. Following that, we will have to convert the ideal beverage cost to percentage.

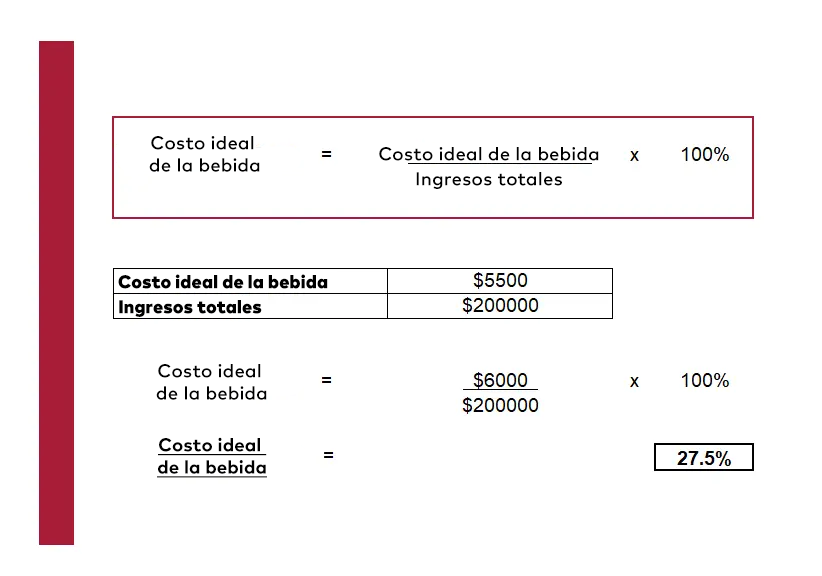

Beverage Cost Variance
The difference between the ideal beverage cost % and actual beverage cost % is the cost variance. The smaller the difference, the better. In the example above, the cost variance is between 30% and 27.5% = 2.5%.
Ideal and actual cost percentages give an idea of how outlets are performing regarding keeping costs under control. Too high a variance may be indicative of some serious issues which require immediate attention from the management. Common issues include:
- Waste
- Poor storage (leading to spoilage)
- Theft
- Unrecorded sales
- Wrong recipe / costing
Interpreting cost data and translating it into actionable strategies is essential for effective cost management in bars and restaurants. The following steps serves as a guide.
- Collect accurate data
- Categorise costs
- Calculate key %
- Benchmark against industry standards
- Identify cost drivers
- Implement corrective changes immediately
- Review costs regularly and make improvements
PROFIT & LOSS STATEMENT (P & L)
Now that you understand some of the key costs involved in a bar operation, it's time to prepare a simple Profit & Loss statement. Also known as an "income statement” or “statement of earnings”, it summarises the revenues, costs, and expenses of a business over a specific period (usually a month, quarter, or year). It provides a snapshot of whether the business has generated a profit or incurred a loss during that period. Below is a simplified example of a profit and loss statement:

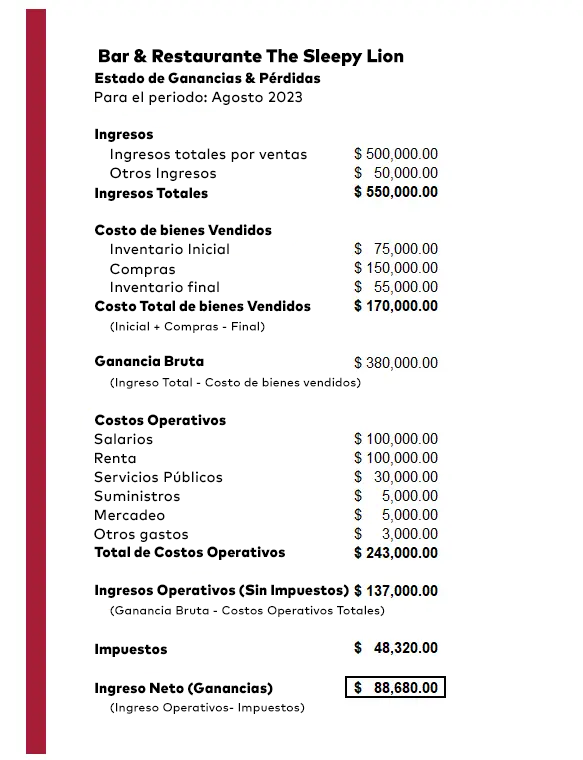
Understanding costs and having a clear grasp of your Profit and Loss (P&L) statement in restaurant bars offers numerous benefits allowing you to identify profit-generating opportunities and areas for cost reduction, price menus competitively, and enable informed decisions on financial planning; ultimately leading to increased profitability.
Empower your team to keep up with industry trends, learn from the experts and discover invaluable resources for their bar career by encouraging them to sign up to the Diageo Bar Academy.
KEY TAKEAWAYS
- Track your inventory to identify which products are selling and which are not. This will help you make informed decisions about what to stock and what to remove from your menu.
- Reduce waste by training your staff to pour drinks accurately, using jiggers and measuring cups, and by using software to track your inventory and sales.
- Negotiate with suppliers to get better prices on products and services. You can also consider buying in bulk or partnering with other bars to get better deals.
- Optimize your menu by removing underperforming items and focusing on your best sellers. You can also consider offering specials or promotions to encourage customers to try new items.
- Monitor your expenses by tracking your sales and expenses regularly. This will help you identify areas where you can cut costs and improve your bottom line.